About Outbreak Templates
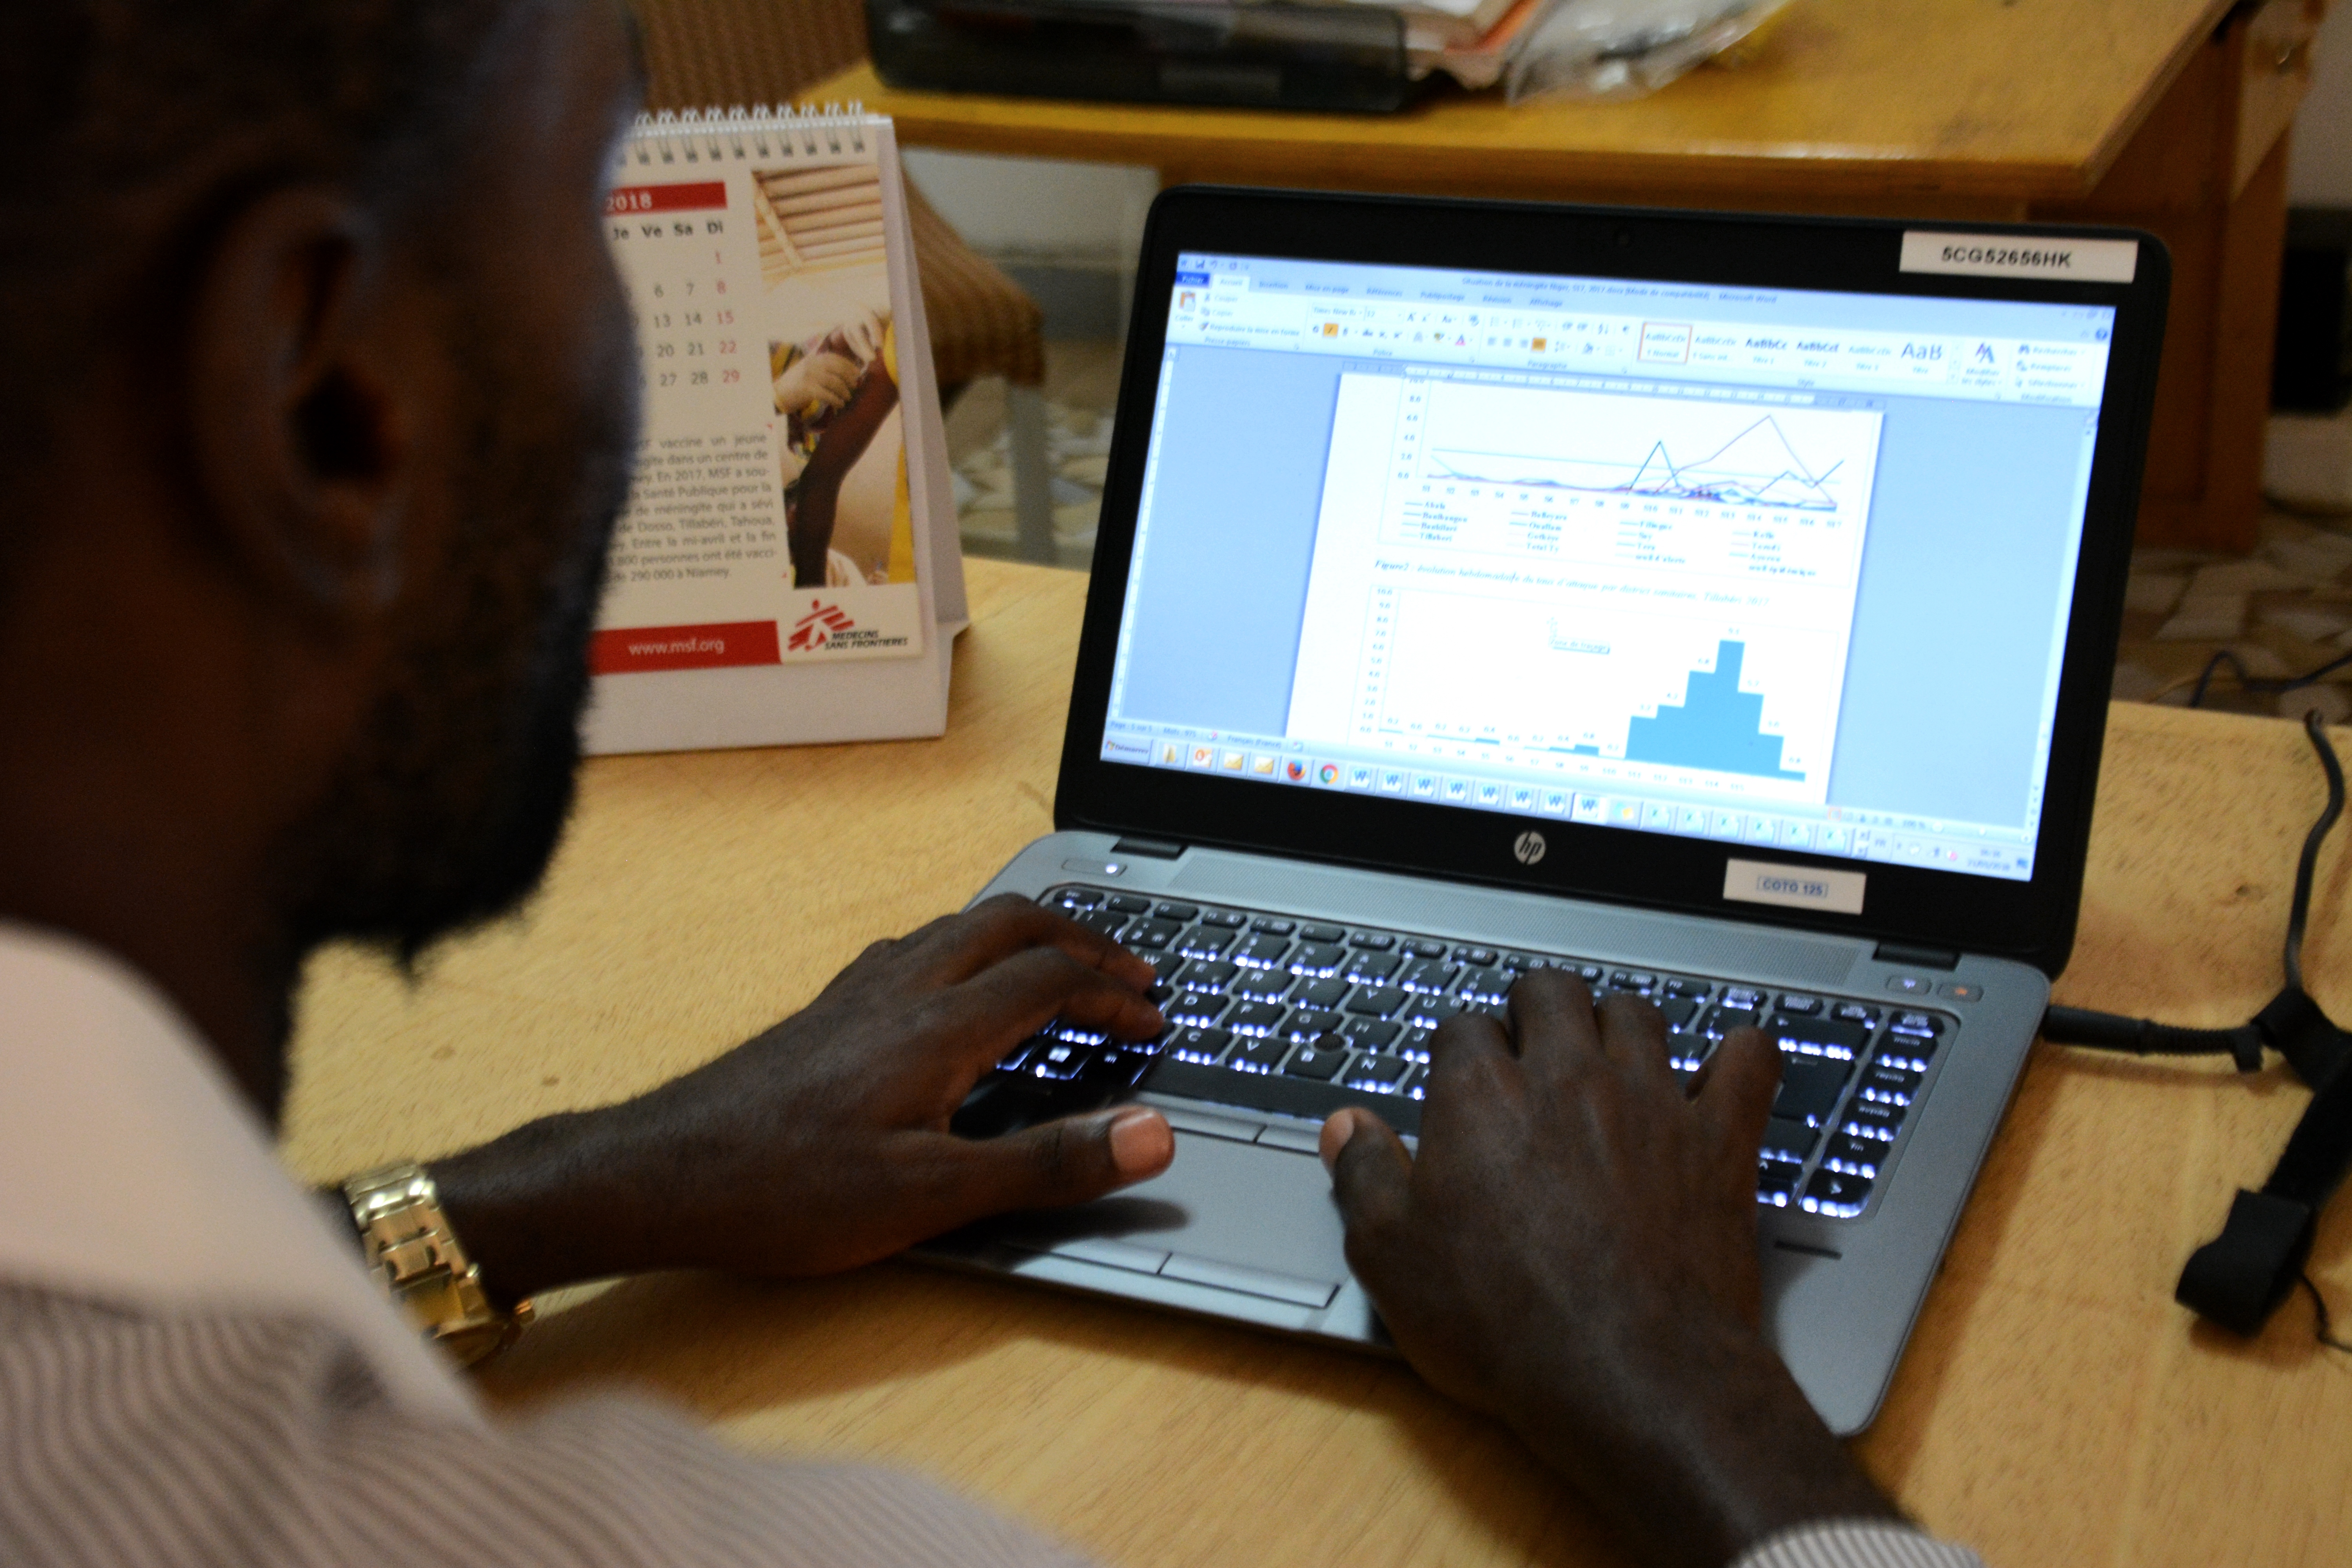
Above: MSF is working with the Ministry of Public Health throughout the year to monitor areas at risks of disease outbreaks. Week after week Louis, the MSF epidemiologist, monitors the health zones that have reported cases and the levels of epidemic alert. He is also in charge of coordinating the post-vaccination coverage survey to ensure that the vaccination coverage rate is sufficient. Source: Elise Mertens/MSF
The outbreak templates have been developed to cover four of the most common outbreak scenarios MSF teams face in our project locations. They include:
- Cholera/Acute watery diarrhea
- Meningitis
- Measles/Rubella
- Acute Jaundice Syndrome (often suspected to be Hepatitis E)
Some recent examples of such outbreak responses and the data analysis done during those outbreaks is available here:
- Cholera epidemic in Yemen, 2016–18: an analysis of surveillance data
- Invasive Meningococcal Meningitis Serogroup C Outbreak in Northwest Nigeria, 2015 - Third Consecutive Outbreak of a New Strain
- Lessons and Challenges for Measles Control from Unexpected Large Outbreak, Malawi
- A large outbreak of Hepatitis E virus genotype 1 infection in an urban setting in Chad likely linked to household level transmission factors, 2016-2017
Getting started
The outbreak and survey report templates are special “RMarkdown” scripts, and are included with sitrep package installation. RMarkdown scripts give you a way of writing your analysis code and report in one document by allowing you to interleave chunks of code that the computer will run in between explanatory text meant for a person to read.
Assistance using the outbreak templates
Read more about RMarkdown scripts and how to modify the templates in the Training Materials pages of this website.
See the page on Reading a RMarkdown to understand more about these special types of R scripts.
Read the case study walk-though, which offers a step-by-step example of using an outbreak template. In the walk-through, you can download the data files and final template to follow along, learning to modify the templates to fit your needs.
To access the outbreak templates:
- Open Rstudio
- Under the ‘File’ button (top left of your screen), click on the “+”
- Then click on “R markdown…”,
- and select “From template”; you should be able to see all the options of templates that are available. For example “Outbreak Report”.
Overview of template parts
We have designed each template to run through a similar series of data management and analytical steps in the same order:
- Import data and perform initial data cleaning
- Browse and view your data to get a sense of your dataset structure, naming of variables, etc.
- Re-naming and recoding variables to help with data analysis (i.e. creation of epidemiological weeks, recoding of age groups, application of case definitions etc.)
- Analysis of personal characteristics: demographics, signs and symptoms, attack rates, risk groups etc.
- Analysis of temporal characteristics: creating graphs that display different indicators in time
- Analysis of spatial/geographical characteristics: creating maps
Data cleaning and standardisation
Epidemiologists know that data cleaning can be a challenging, laborious (but critically important) task. One goal of sitrep is to streamline data cleaning steps as much as possible. The outbreak templates are designed to efficiently import data, manage dates, standardise variable names and values, and otherwise set-up the datasets for analysis.
Cleaning will be the most straight-forward for datasets produced with DHIS2 software in accordance with MSF data dictionaries, but the sitrep tools are built to be used in many other scenarios.
Analyses
Situation reports for outbreaks typically focus on describing the data in terms of person, time, and place. The template contains sections for each of these core characteristics.
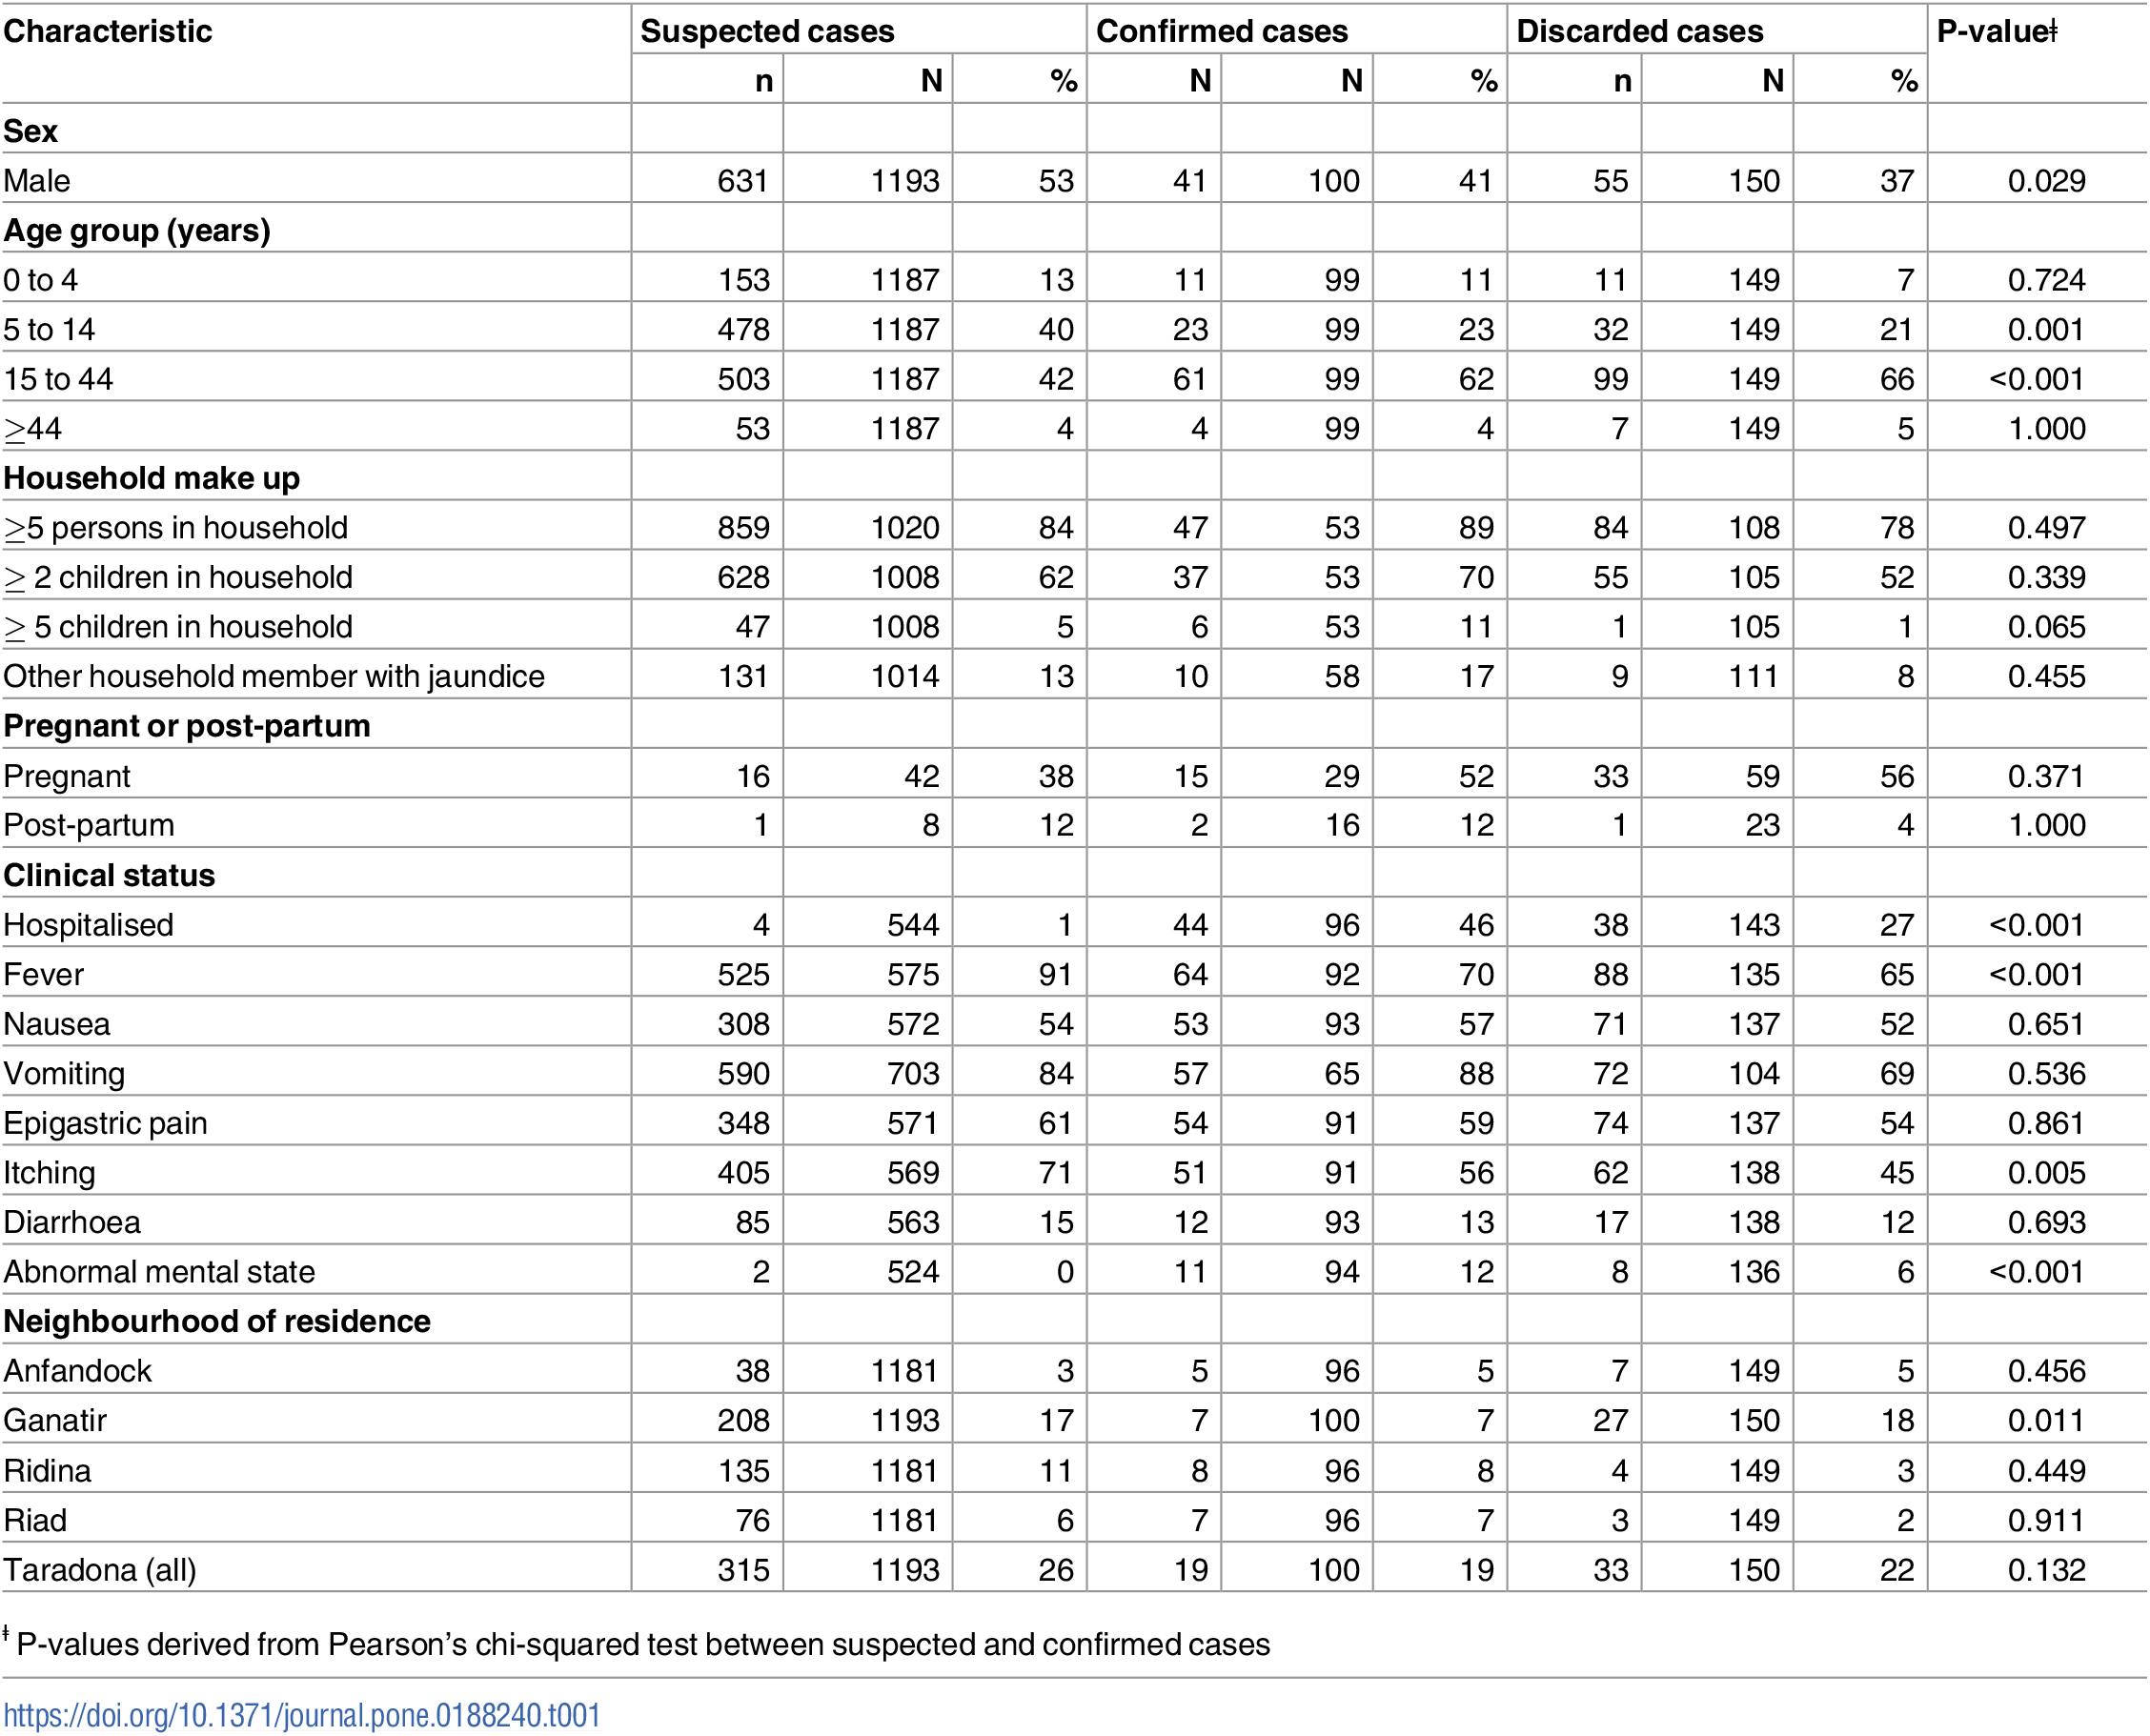
Person characteristics
This will include a series of graphs or tables that show the demographic breakdown of the cases identified in the outbreak. It will include a comparison in attack rates and mortality rates in different age and gender groups to help guide the analysis to the identification of risk groups for infection and death.
This information can help identify priority groups for public health interventions and prevention activities or for improved/different clinical management approaches.
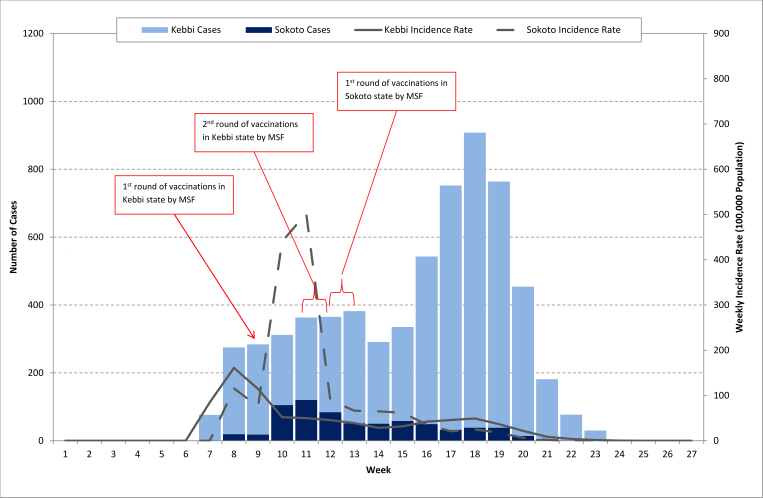
Time characteristics
Usually the main component of this will include the creation of an “epidemic curve” which demonstrates the dynamics of the outbreak in time (by day of the outbreak or epidemiological week).
The epidemic curve will give an understanding about the mode of transmission of the outbreak in question and also possibly whether the outbreak is slowing down or still not under control.
Place characteristics
Here you will create tables and maps to illustrate the geographical spread and impact of the outbreak. Maps can aid in the identification of hotspots for the targeting or improvement of prevention and public health measures.
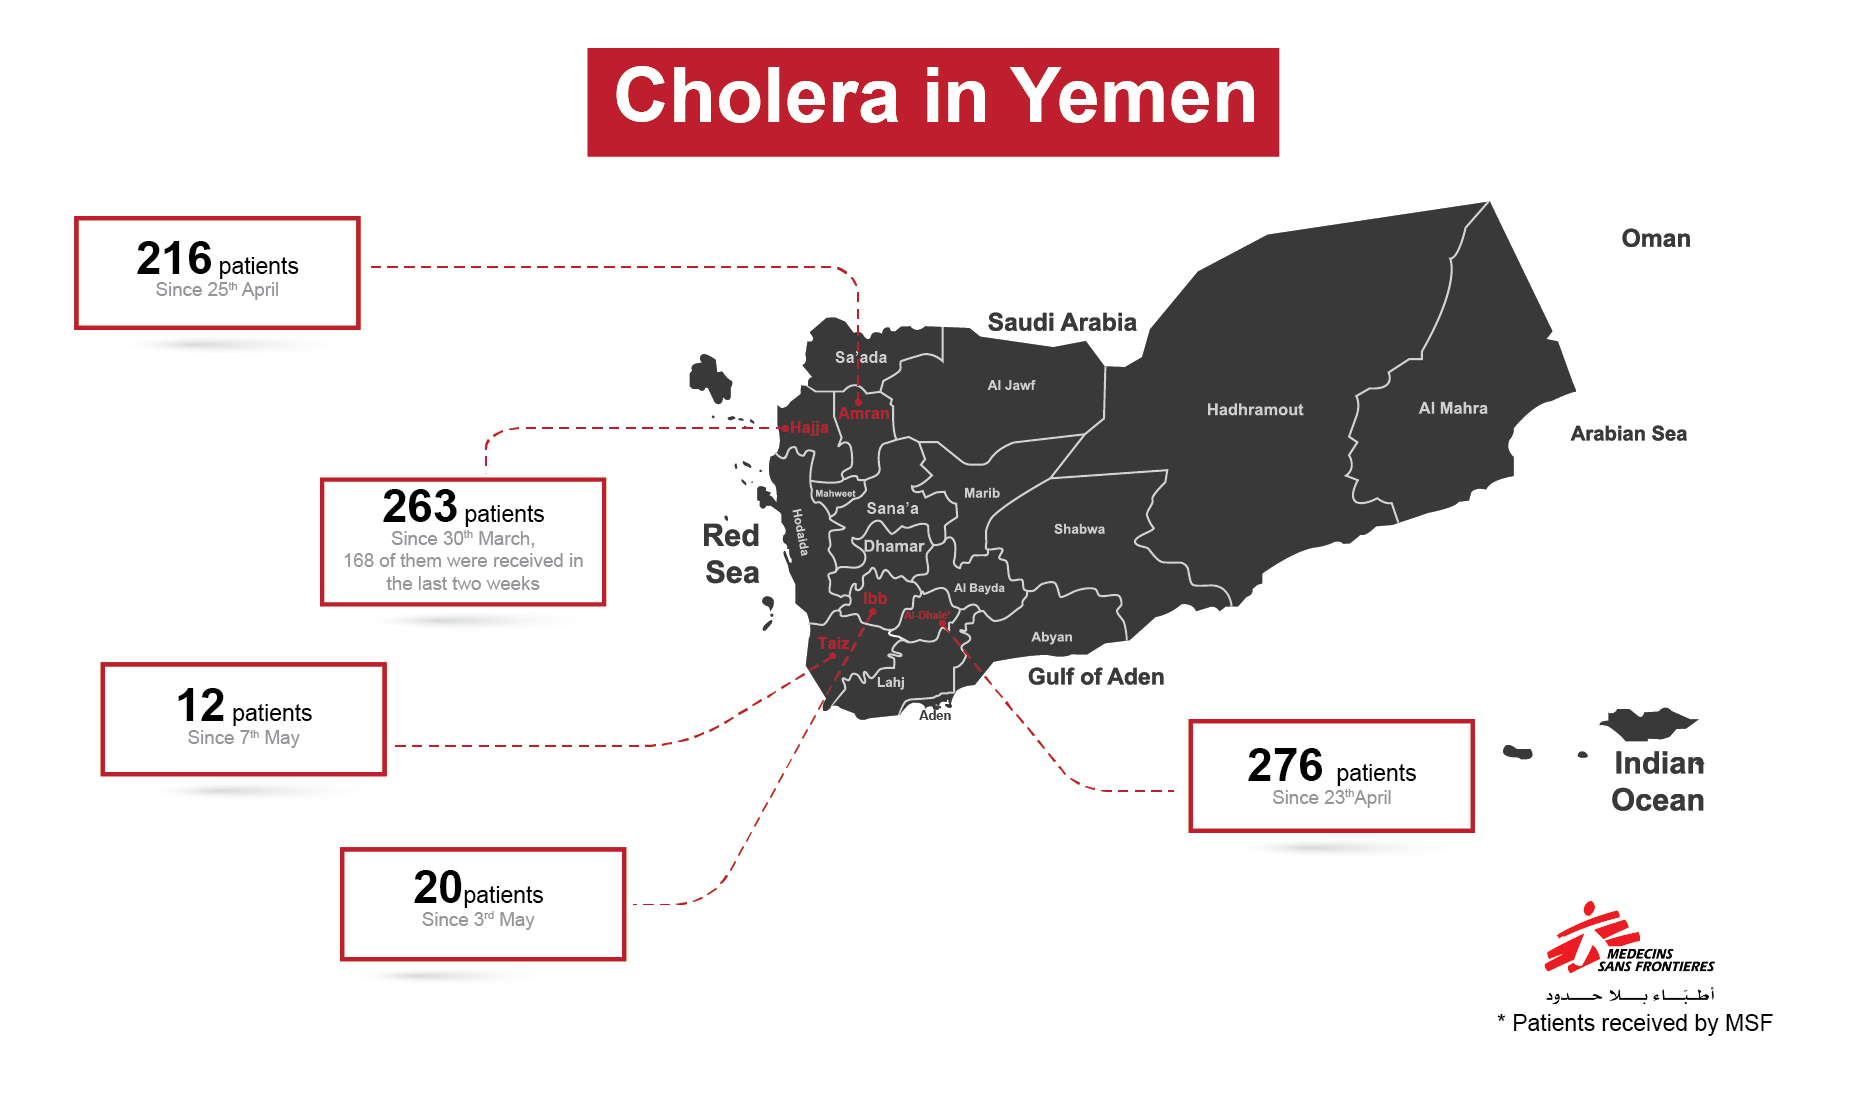
Source: MSF calls for increased response to cholera outbreak
Example data included in the templates
The outbreak templates are constructed so that you can run them with no modifications and they will produce a report based on an internally-generated example dataset. This helps you understand how the reports are produced and begin your modifications from a functioning template.
Other uses of the templates
Code and sitrep functions included in the outbreak templates can also be used to help guide you through epidemiological analyses on other data, such as:
- outpatient registers
- hospital registers
- other surveillance data
The data dictionaries may not be applicable to these other use-cases, but you should be able to similarly recode and rename variables, create graphs and tables of relevant variables and if necessary generate maps.
There is also code to help you conduct simple statistical comparisons between groups (chi square, t-test etc.), as well as the calculation of Odds Ratios (ORs) and Risk Ratios (RR) and running regression models for multivariate analyses.