Functions
Simple Functions
Most tasks in R are performed through functions. A function is like a machine that receives inputs, does some action with those inputs, and produces an output. What the output is depends on the function.
Functions typically operate upon some object placed within the function’s parentheses. For example, when the function summary() is used on a variable of class numeric, the output is a summary of the variable’s numeric and missing values.
summary(linelist_raw$age_years)## Min. 1st Qu. Median Mean 3rd Qu. Max. NA's
## 3.00 29.00 62.00 60.86 92.50 120.00 13On installation, R contains “base” functions that perform common tasks. Specialized functions have been created by R users, verified by the R community, and can be downloaded within “packages” to your RStudio for use. One of the more challenging aspects of R is that there are often many functions to choose from to complete a given task.
Functions with Multiple Arguments
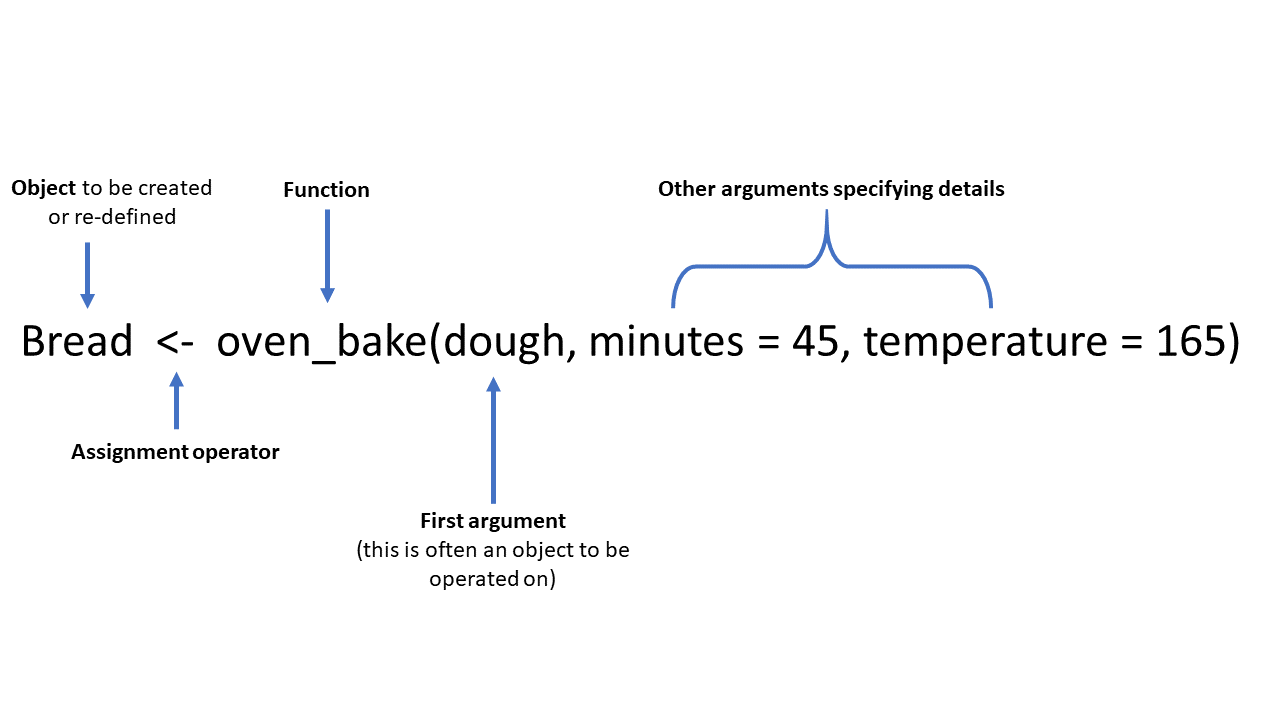
Functions often ask for several inputs. Each piece of information needed is called an argument. Some arguments are required for the function to work correctly, some are optional. Arguments can take character, numeric, logical (TRUE/FALSE), and other inputs. Optional arguments have default settings if they are not specified. Arguments are located within the parentheses of the function, usually separated by commas.
For example, this
plot_age_pyramid()command in the templates produces an age pyramid graphic based on defined age groups and a binary split variable, such assex. The function is given three arguments within the parentheses, separated by commas. The values supplied to the arguments establishlinelist_cleanedas the data frame to use,age_groupas the variable to count, andsexas the binary variable to use for splitting the pyramid.
# Creates an age pyramid by specifying the dataframe, age group variable, and a variable to split the pyramid
plot_age_pyramid(data = linelist_cleaned, age_group = "age_group", split_by = "sex")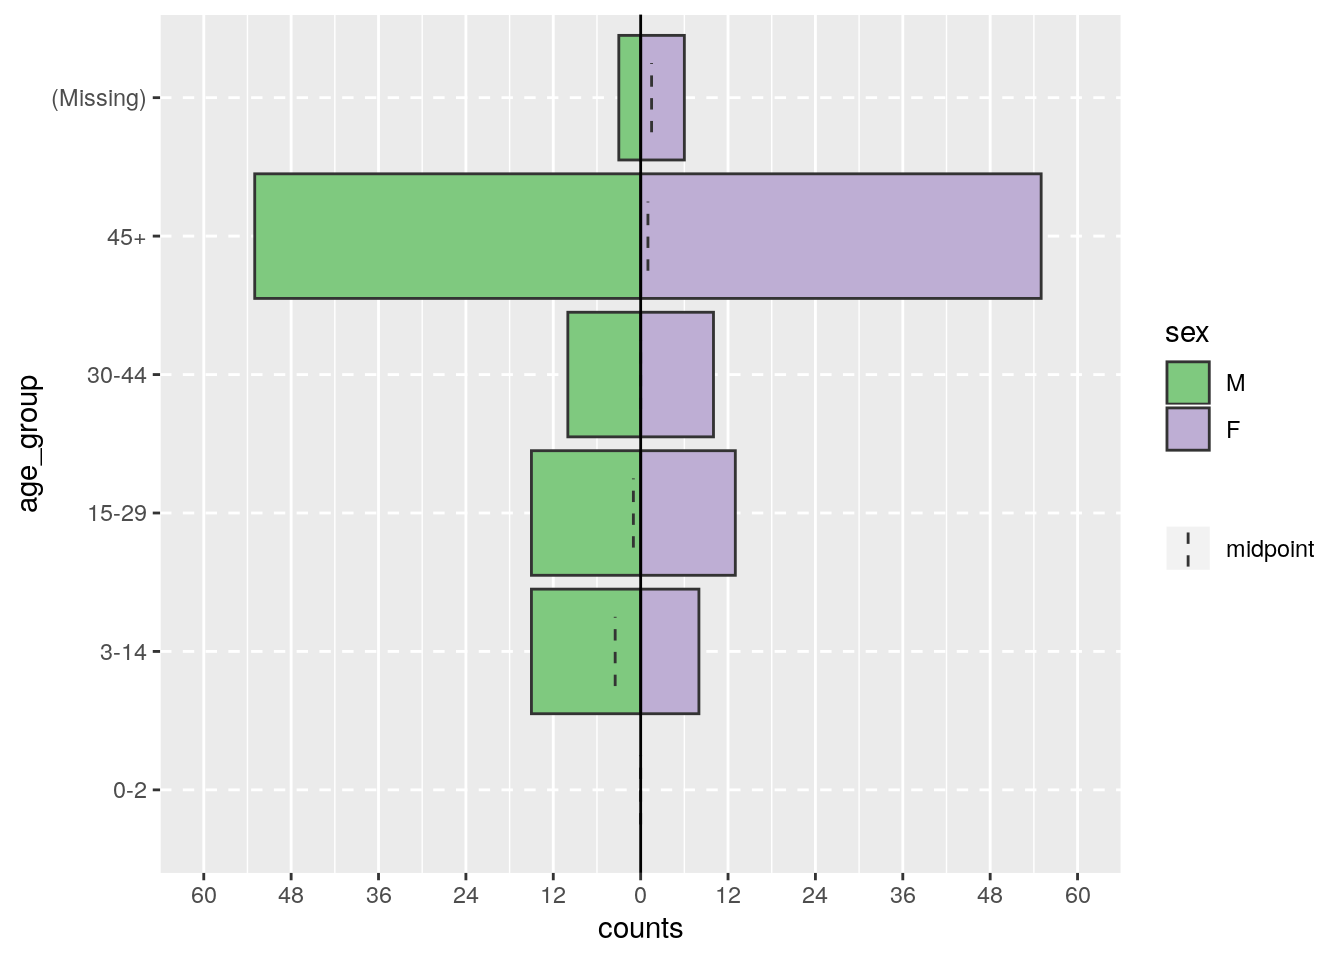
Often, the first half of argument assignment (e.g.
data =) does not need to be specified if the arguments are written in a specific order (specified in the function’s documentation). The below code produces the exact same pyramid as above, because the function expects the argument order: data frame,age_groupvariable,split_byvariable.
# This command will produce the same table as above
plot_age_pyramid(linelist_cleaned, "age_group", "sex")
A more complex plot_age_pyramid command might include the optional arguments to:
- Show proportions instead of counts (set
proportional = TRUEwhen the default isFALSE)
- Specify the two colors to use (
pal =is short for “palette” and is supplied with a vector of two color names. See the Objects page for how the functionc()makes a vector)
For arguments specified with an equals symbol (e.g. coltotals = …), their order among the arguments is not important (must still be within the parentheses and separated by commas).
plot_age_pyramid(linelist_cleaned, "age_group", "sex", proportional = TRUE, pal = c("orange", "purple"))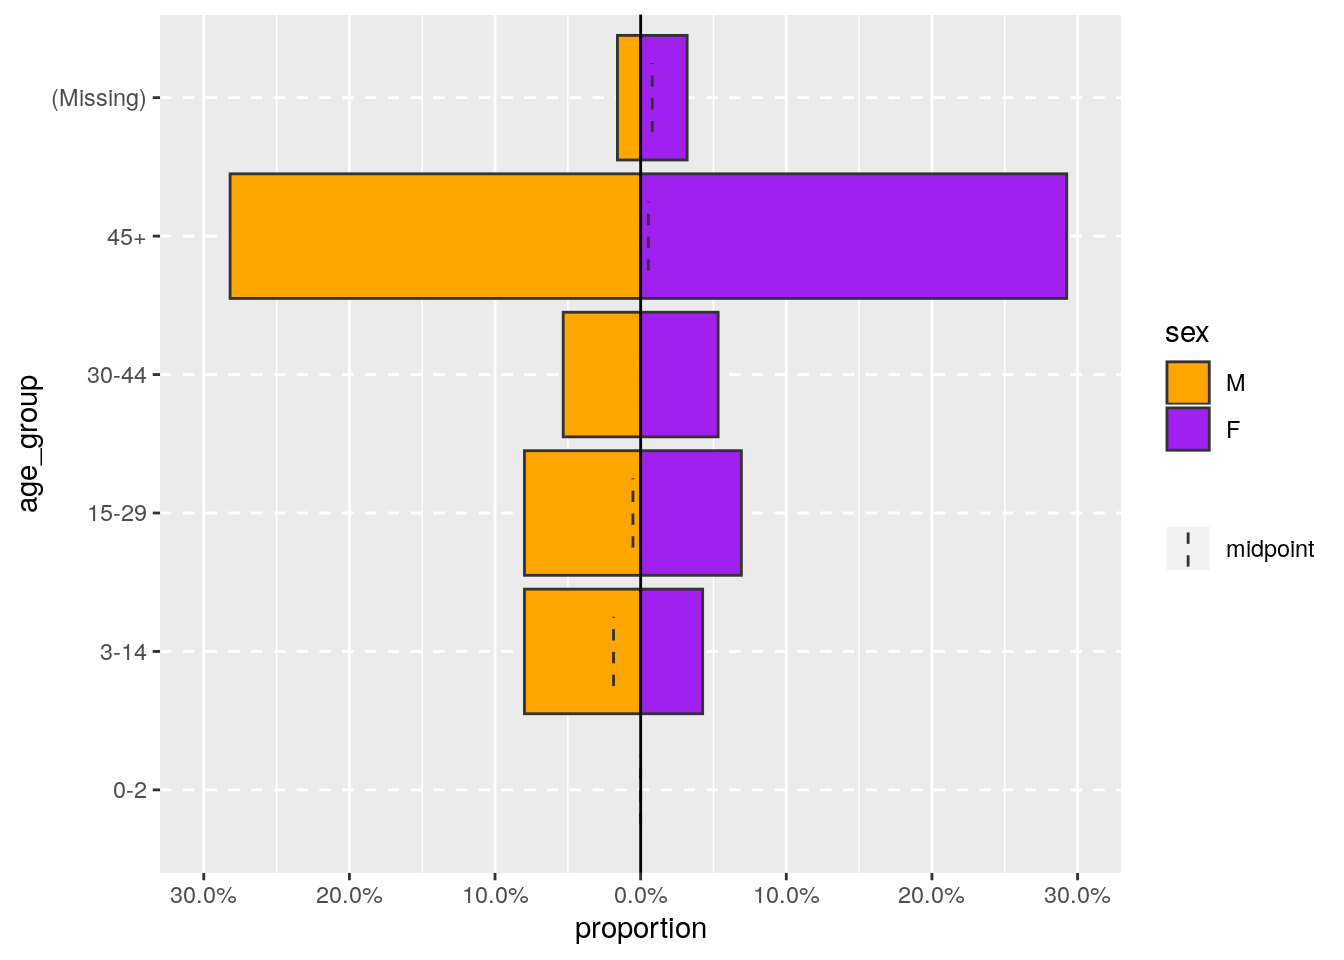
Using Additional Functions
R comes with “base” functions, but the R community has created and verified many other specialized functions that are available to you. These functions are contained within packages that can be downloaded to your computer. Once downloaded, you access the functions within a package by calling the package with the library() command at the beginning of each R session.
While you only have to install packages once, you must load them at the beginning of every R session using library(). There is a code chunk at the beginning of each template that loads the necessary packages.
Think of R as your personal library: When you download a package your library gains a book of functions, but each time you want to use a function in that book, you must borrow that book from your library.
For clarity in the templates, functions are often preceeded by the name of their package using the :: symbol in the following way:
package_name::function_name()
#This line uses the package "rio"" and it's function "import" to import a dataset
linelist_raw <- rio::import("linelist.xlsx", which = "Sheet1")
The Pipe Operator (%>%) between functions
Within the template scripts you will see the pipe operator %>%. Simply explained, the pipe operator passes an intermediate output from one function to the next. You can think of it as saying “then”. Many functions can be linked together with %>%.
Piping is not a base function. To use piping, the dplyr package must be installed and loaded. Near the top of every template script is a code chunk that installs and loads the necessary packages, including dplyr. You can read more about piping in the documentation.
For example: The following code chunk from the AJD template data cleaning section can be read as “
linelist_cleanedis defined aslinelist_cleaned, filtered to remove the rows where the variablescase_numberanddate_of_admissionare missing”
# only keep variables with a case ID and a date of consultation
linelist_cleaned <- linelist_cleaned %>%
  filter(!is.na(case_number) & !is.na(date_of_admission))
Remember that even when using piping to link functions, if the assignment operator (<-) is present, the object to the left will still be over-written (re-defined) by the right side. In the code above, linelist_cleaned will be replaced by the new linelist_cleaned which likely has fewer observations.
Help with functions
To read more about a function, you can try searching online for resources OR use the Help tab in the lower-right R pane.