Import population and lab data
Provide population counts
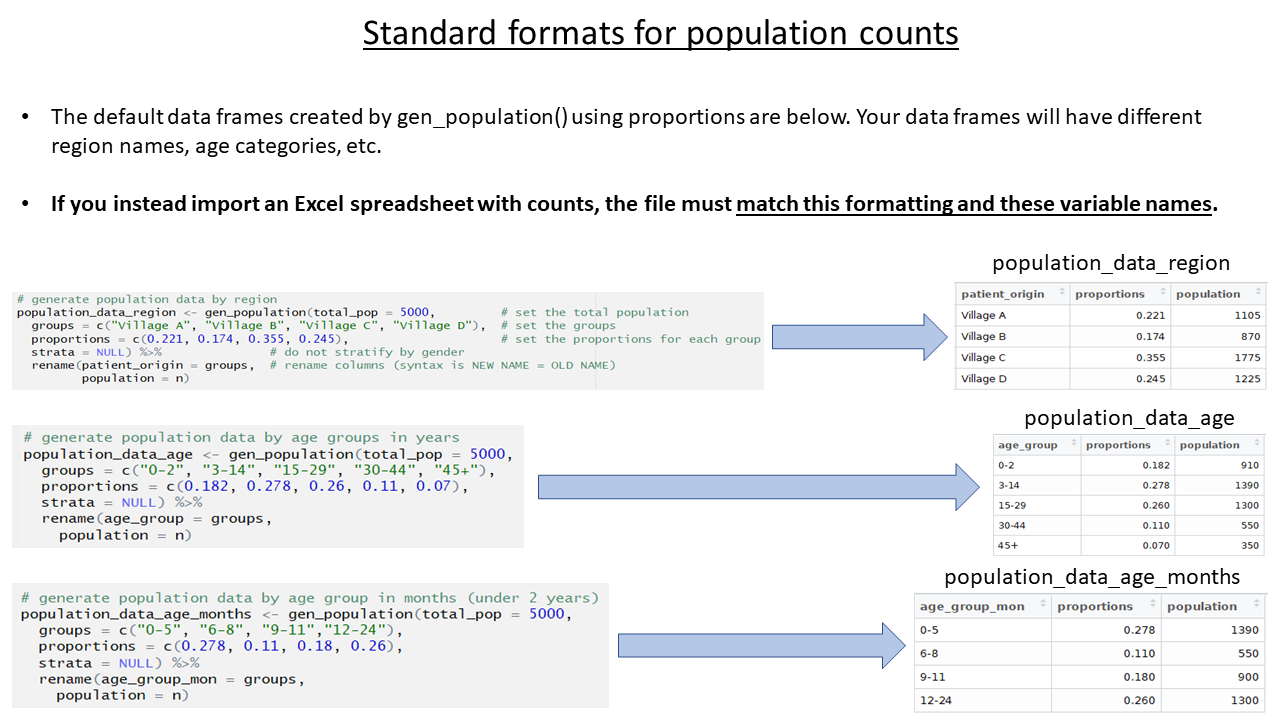
The population estimates for regions and age groups are collected in order to calculate incidence, attack rates, and mortality rates. The template allows several ways to provide population estimates, but importantly, the data must be stored under specific variable names. In your real-use case, the specific age groupings and region names in your data may differ from the examples, but the variable names must follow the expected standard.
You can do one of the following:
- Import a spreadsheet file with the estimates in the correct format
- Use the function
gen_population()to derive the estimates from proportions based on globally accepted standards
- Use the function
gen_population()to directly enter counts
For this case study, we import an Excel spreadsheet containing population data by quartier (available for download in the case study overview page).
See the read_population_data chunk and modify the first command to import the Excel spreadsheet. We will assign the imported Excel sheet to the object name population_data_region (note the change from population_data), because the data we are importing is for regions (quartiers).
The command uses import() wrapped around here() to locate the file. The which= argument of import() specifies that the sheet “quartier” should be imported.
Note that the variables names in the spreadsheet have already been edited to match the expected variable names (“patient_origin” and “population”).
The import() function is wrapped around the here() function. The here() function makes it easy for R to locate files within a project. It is best to save the dataset within your R project, and to provide here() with any R project subfolder names. You can read more about the here() function in the R Basics - Importing Data page.
population_data_region <- rio::import(here("AJS_AmTiman_population_revised_for_template.xlsx"), which="quartier")Before moving on, delete or comment (#) all the code lines in the chunk that create fake data or proportions for population_data_region, population_data_age, and population_data_age_months.
If you choose not to complete the population estimates section at all, delete or comment (#) all code in this section, and expect that later sections on attack and mortality rates will not produce output.
Provide laboratory testing data
In this example, laboratory testing data is already included in the linelist dataset. Therefore, there is no need to import a separate laboratory testing dataset.
In your personal use-case, if you have a separate laboratory dataset, use the alterate code provided in the template to import and then join that dataset to the linelist dataset. You can join them based on an ID or case number variable that is present in both datasets. For more information about joins, see the R Basics - Advanced and Miscellaneous page.
